## Effective Browser JavaScript Debugging
Using the same browser you **already have**
Vance Lucas
## Your Browser is JavaScript IDE
* Browser is primary JS runtime for everyone
* Extensive debugging and performance profiling tools already built-in (no plugins or downloads required)
* Benefit from hundreds of millions of $$$ worth of work browser vendors put in competing with each other
## All Modern Browsers
* Google Chrome*
* Mozilla Firefox (and Firefox Developer Edition)
* Apple Safari
* Microsoft Edge
_* All examples/screenshots are from Chrome_
## Available Tools
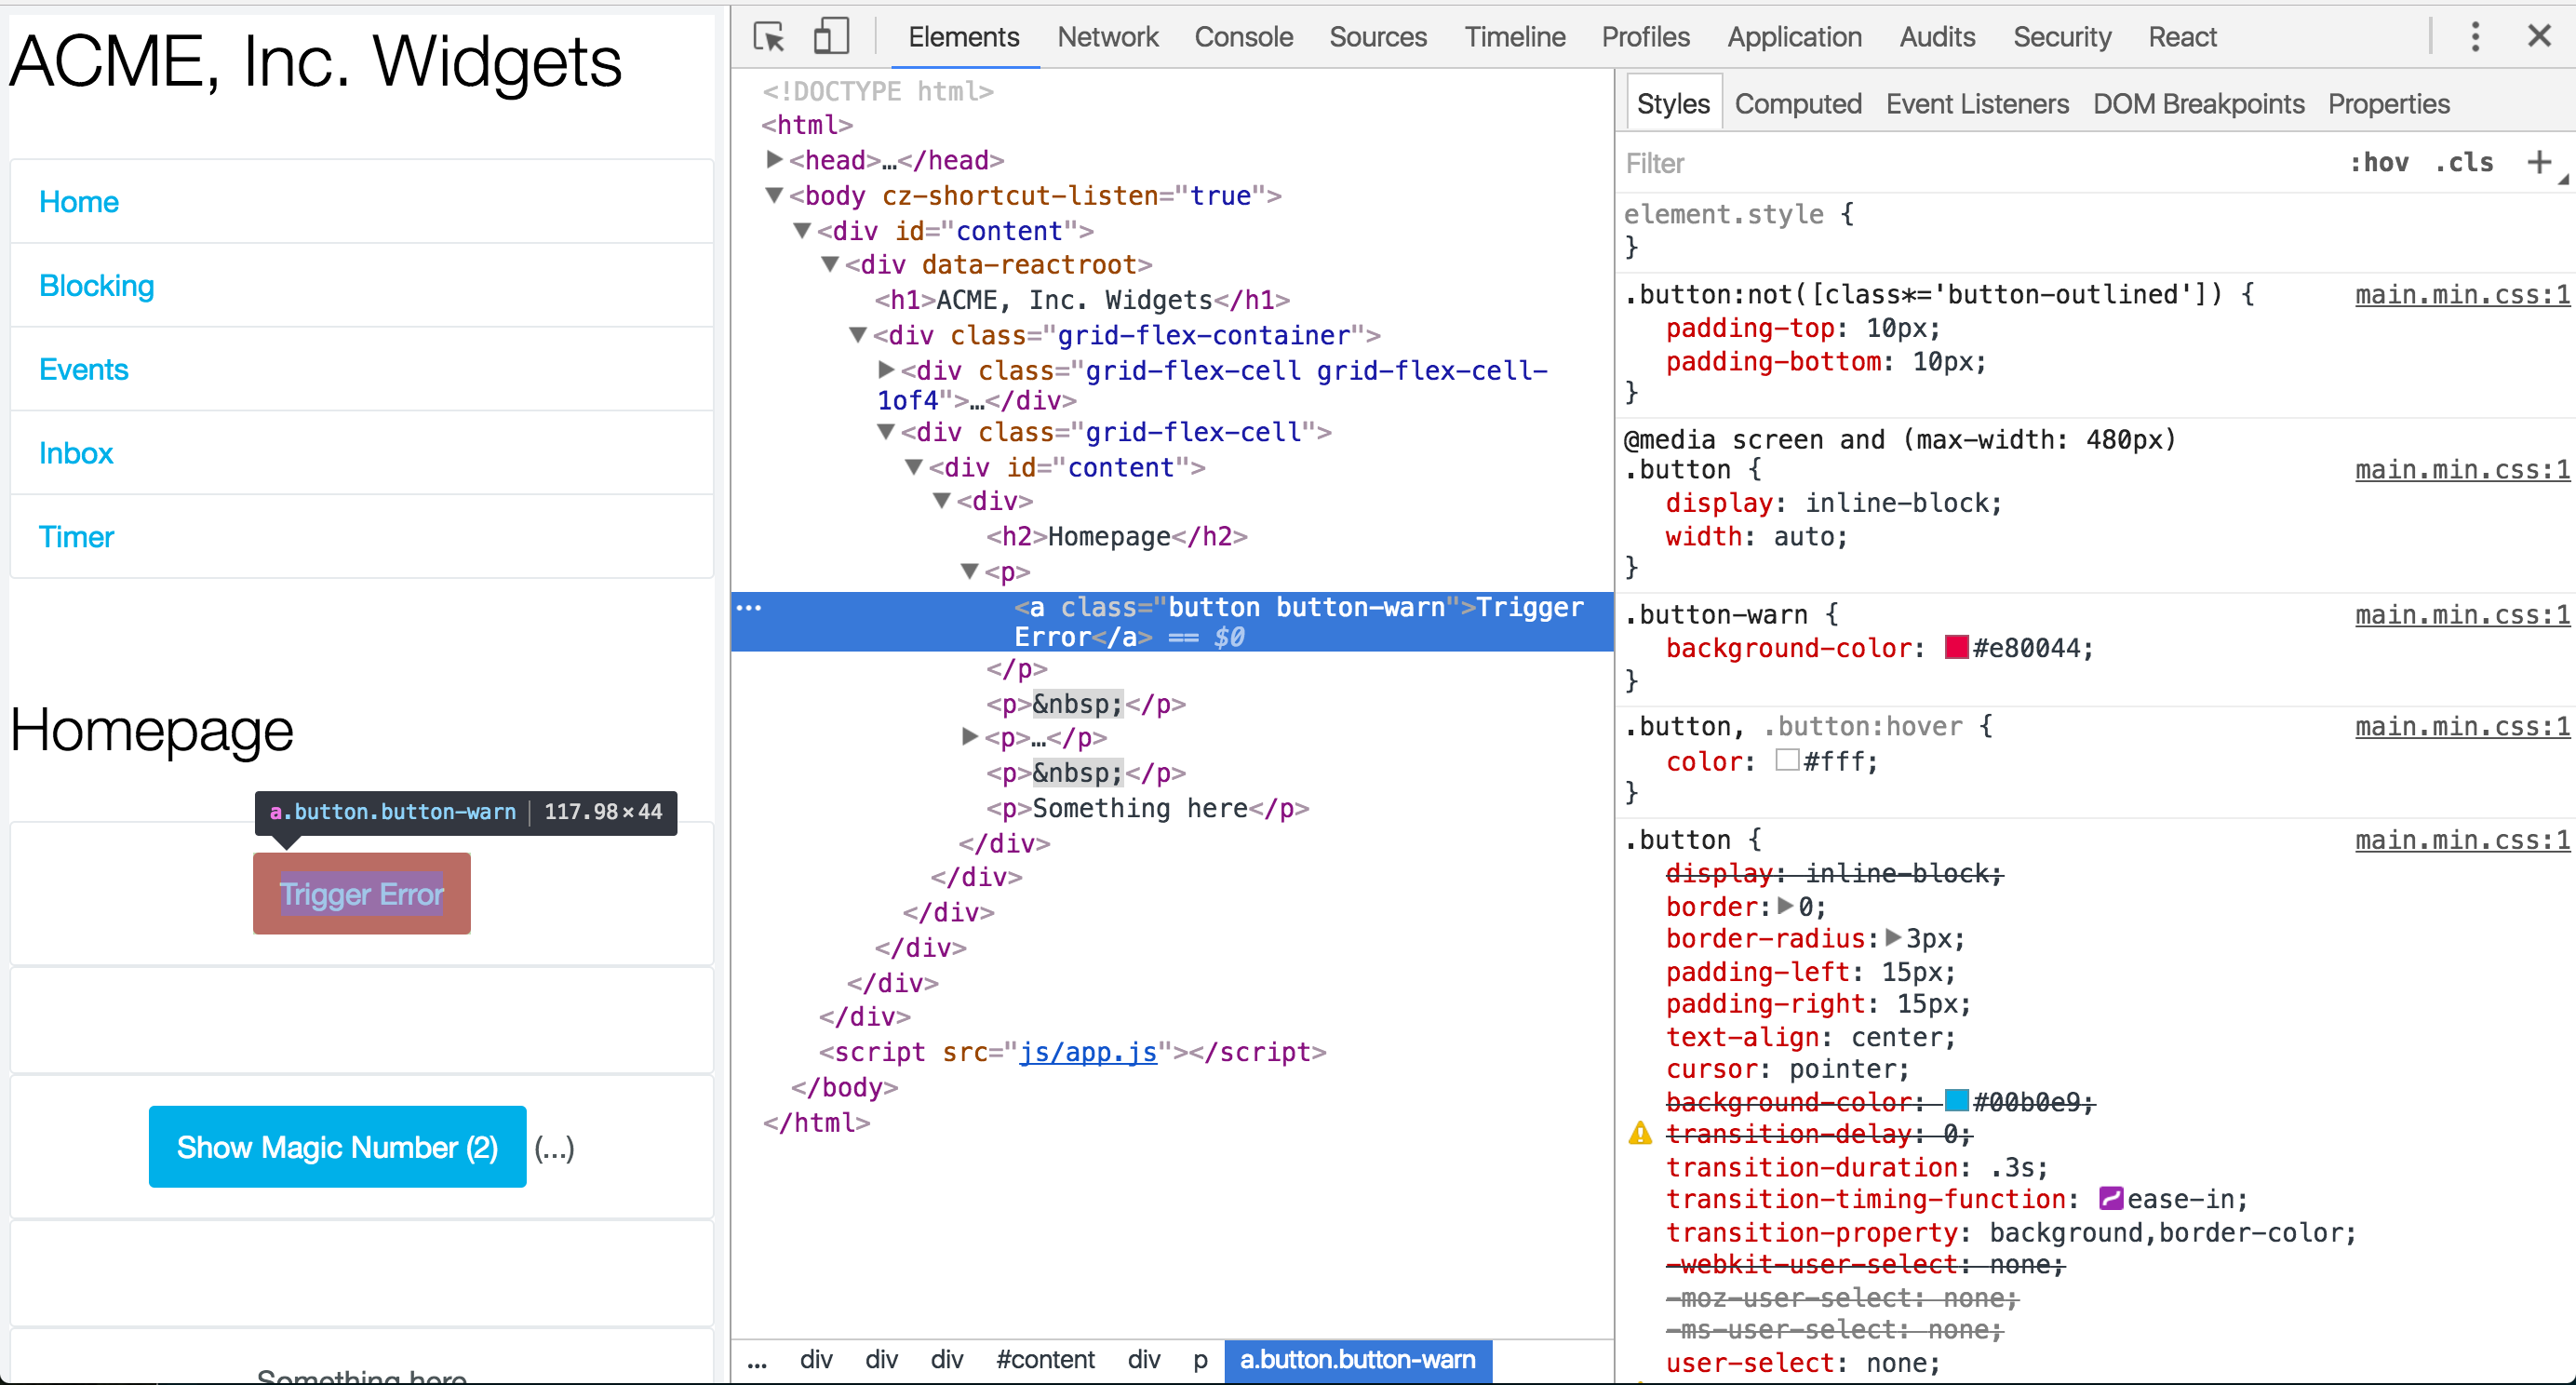
* Element inspection & editing
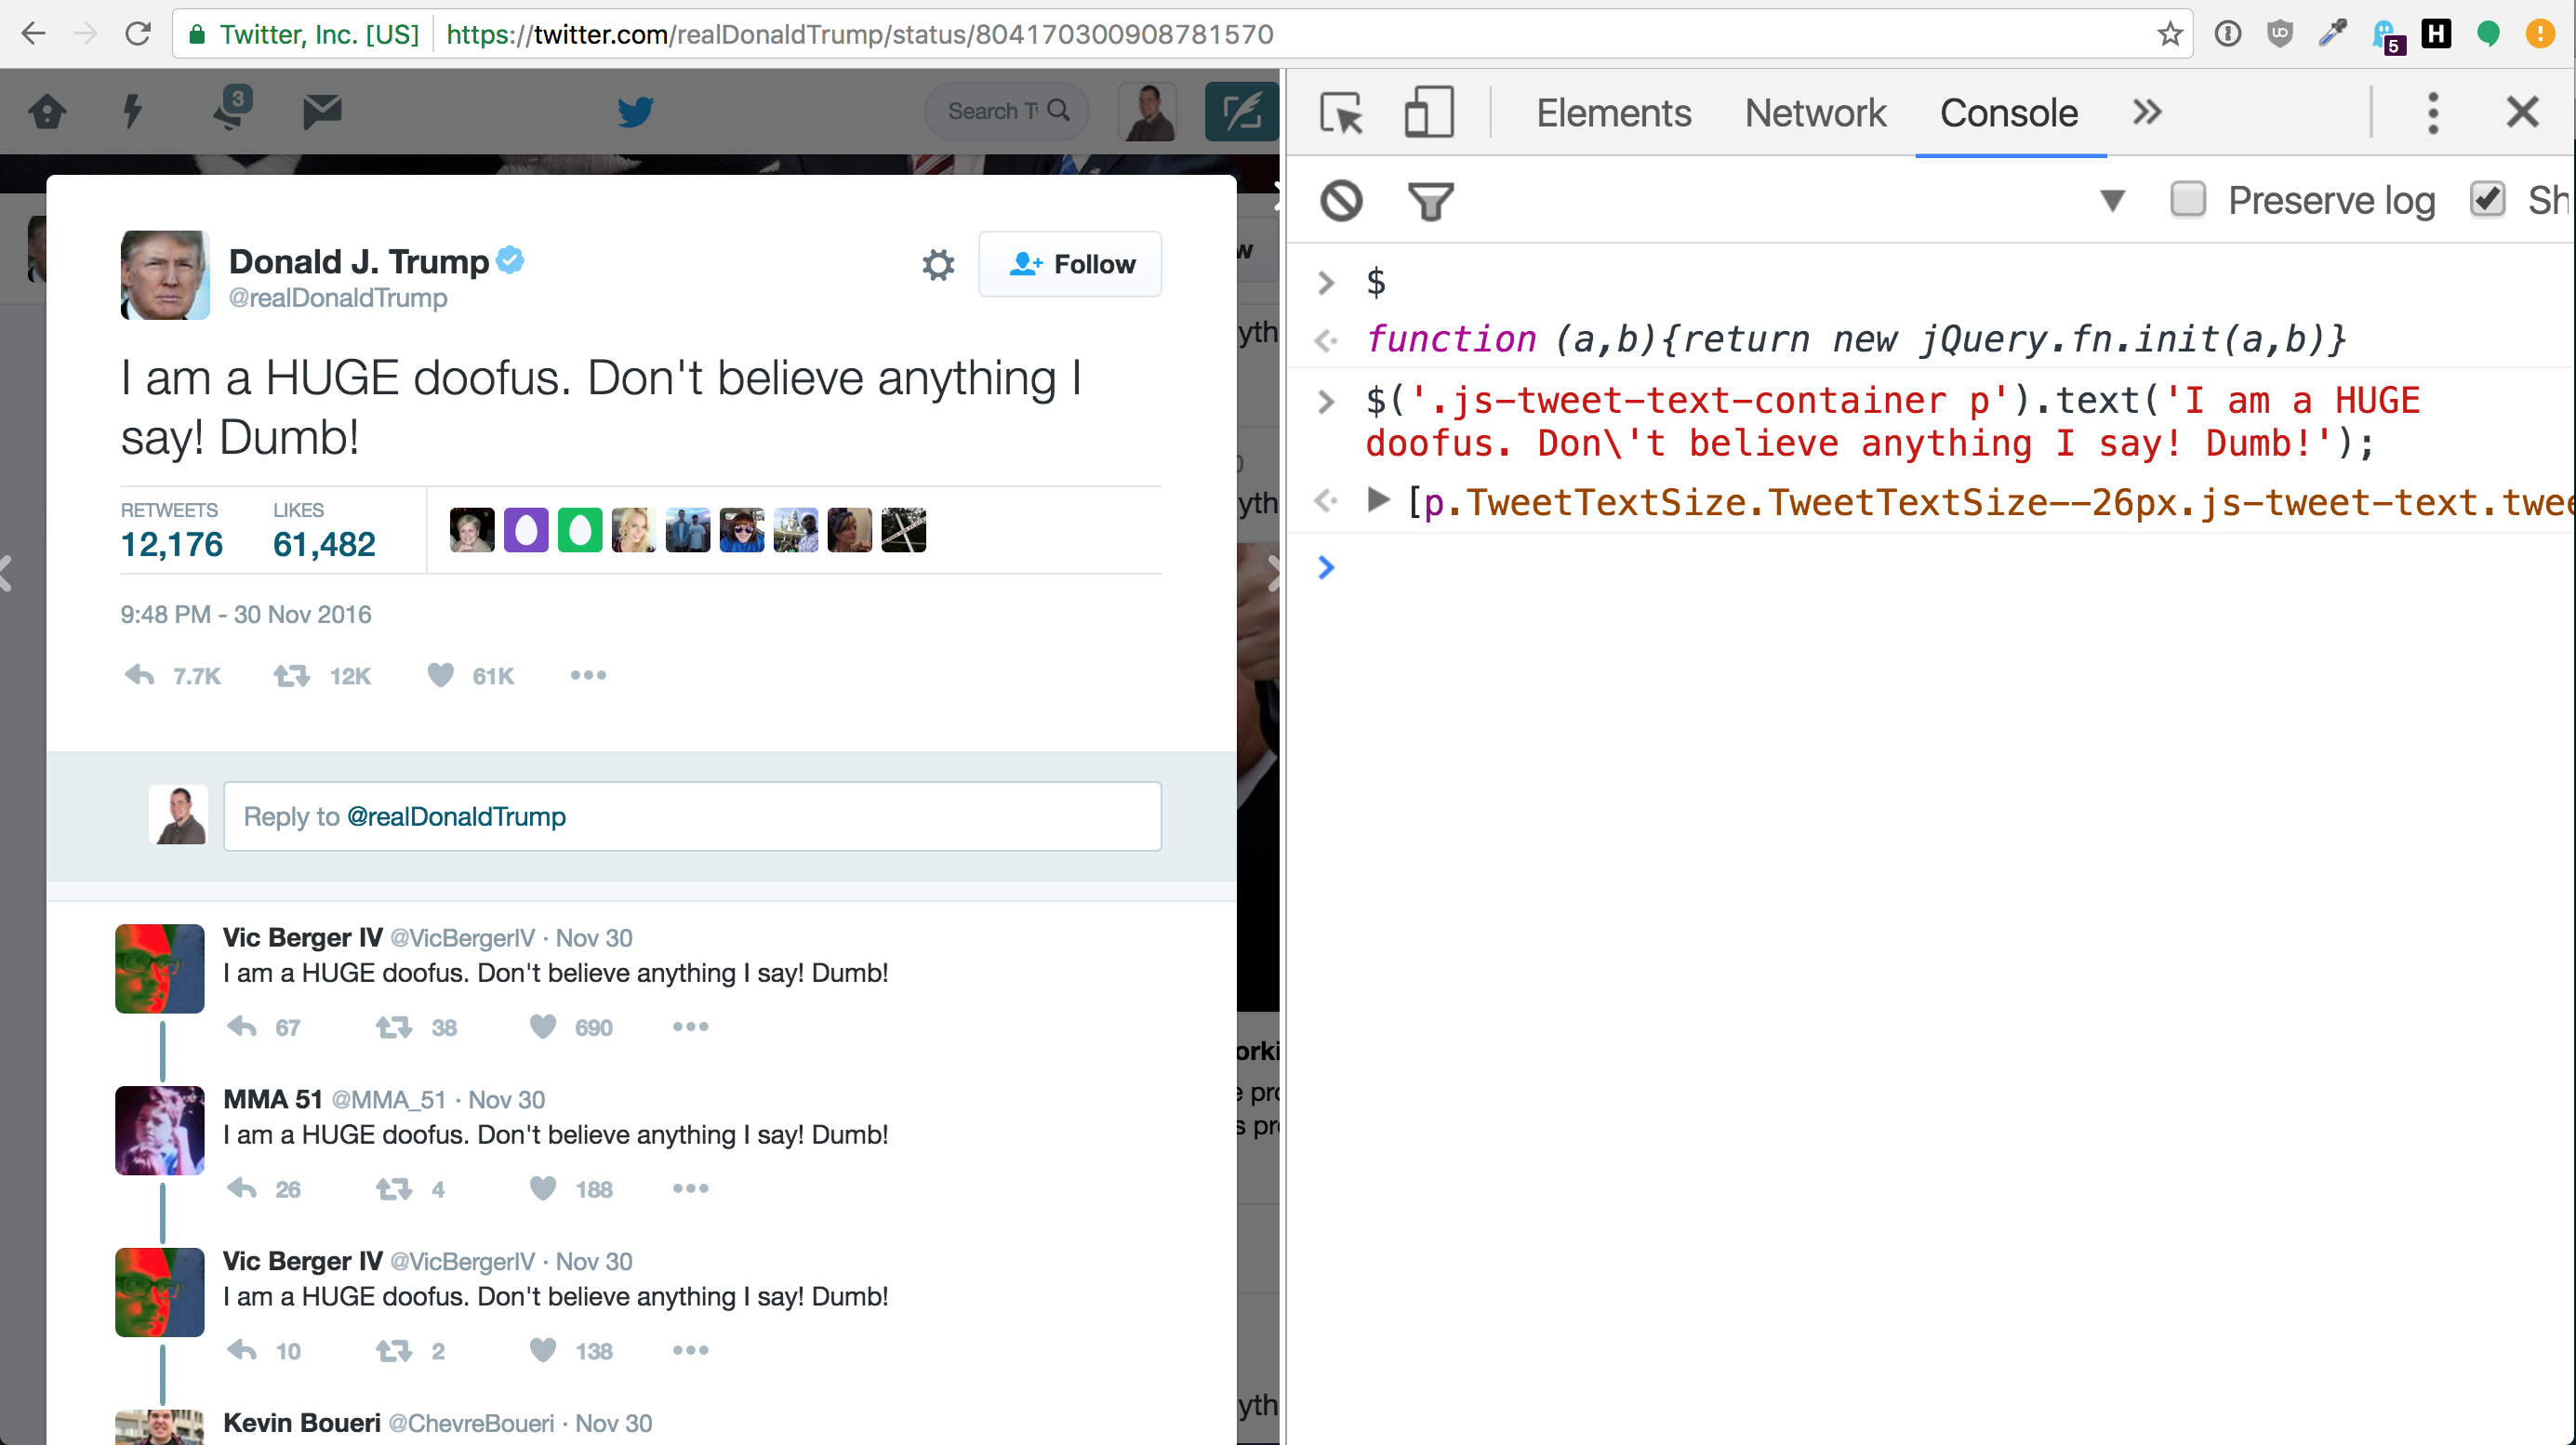
* Interactive console
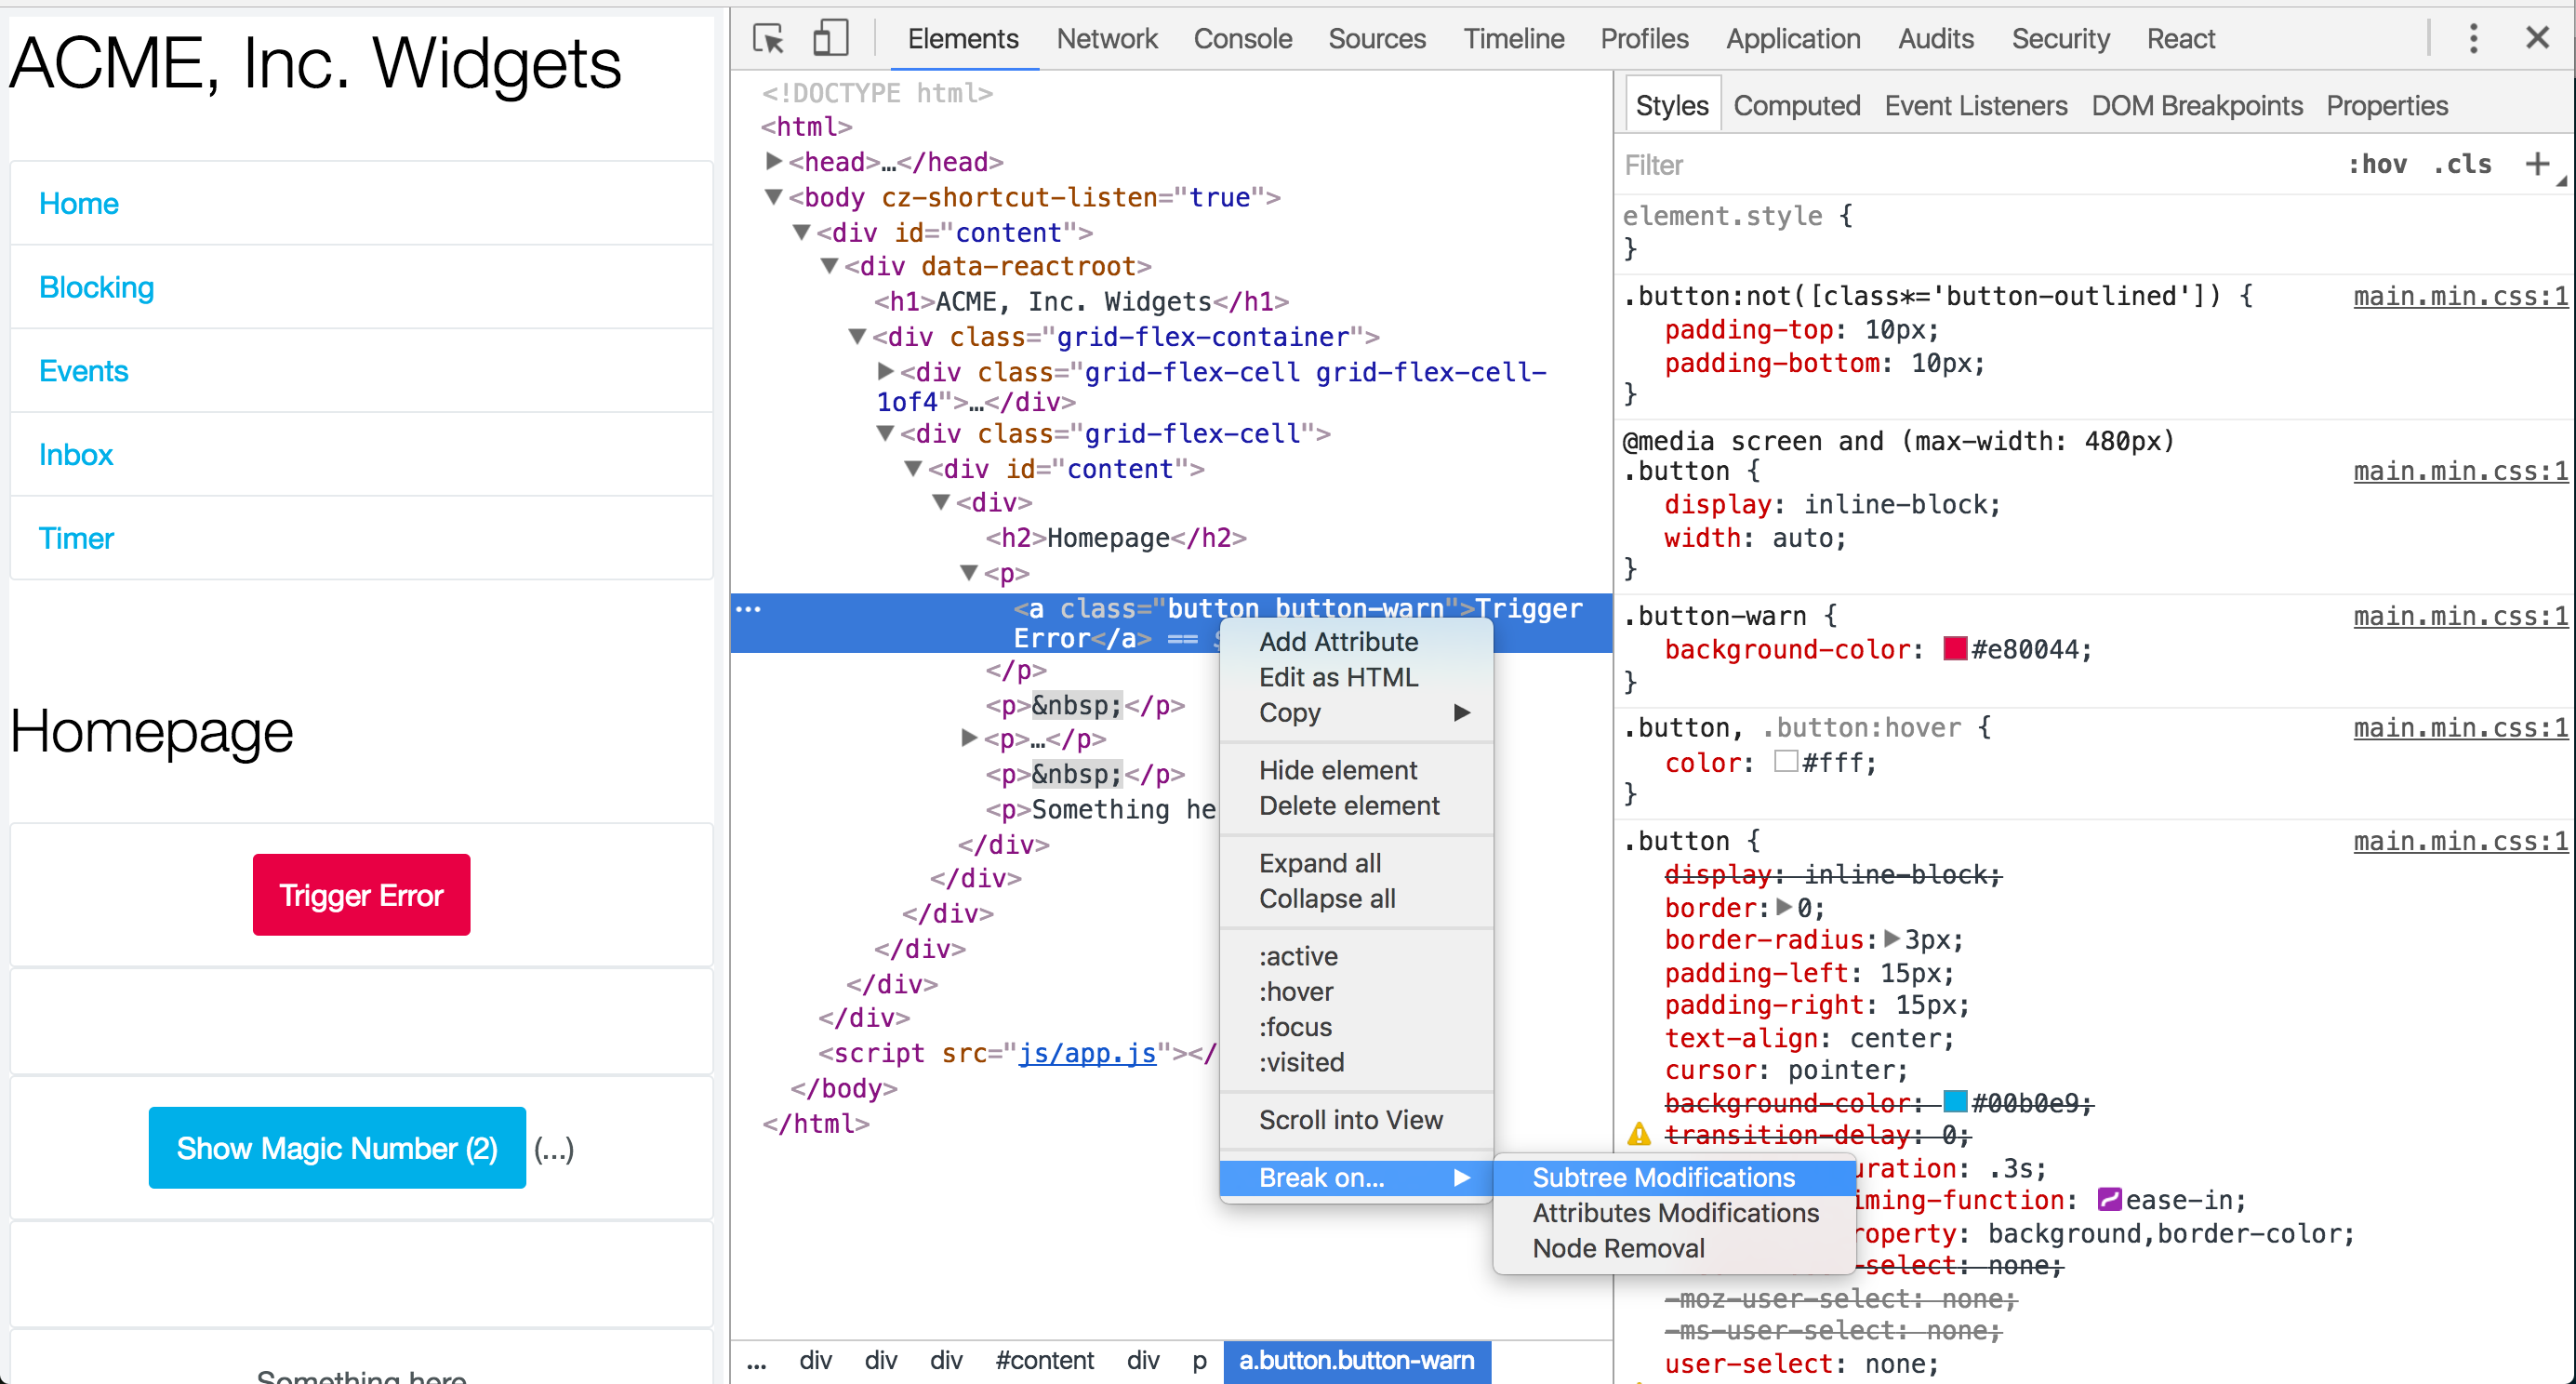
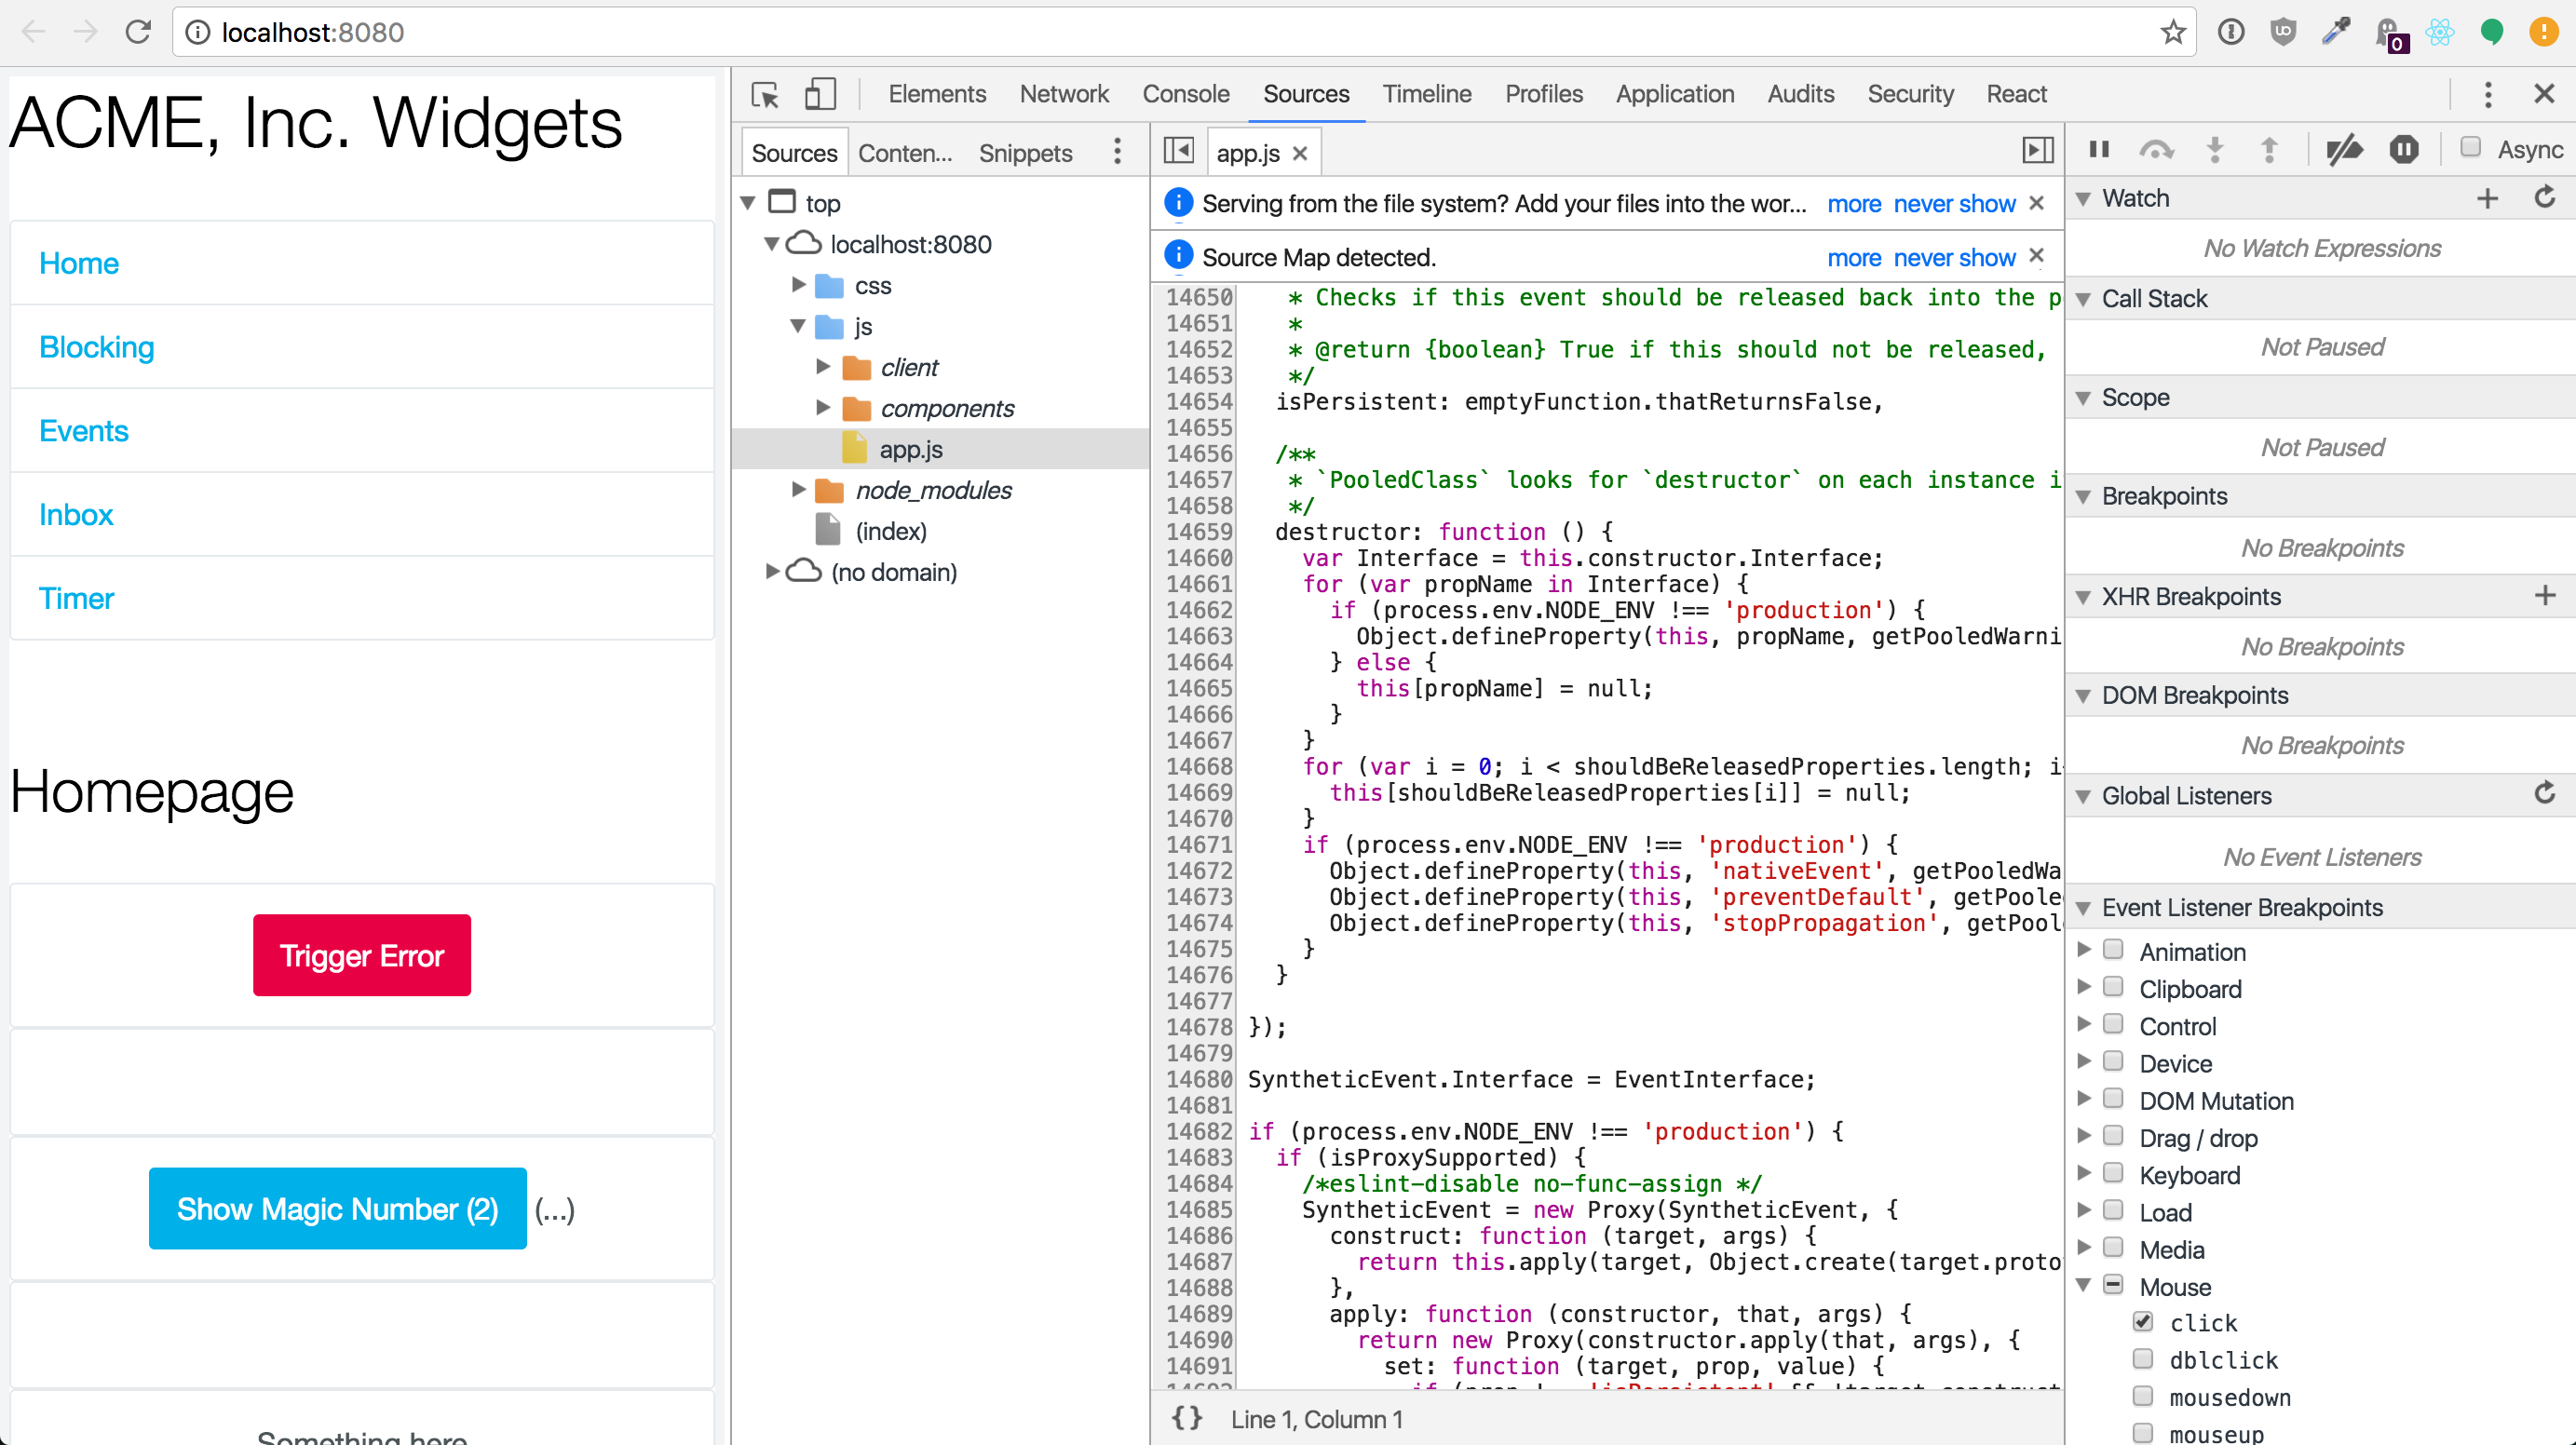
* Debugging with breakpoints
* DOM
* XHR
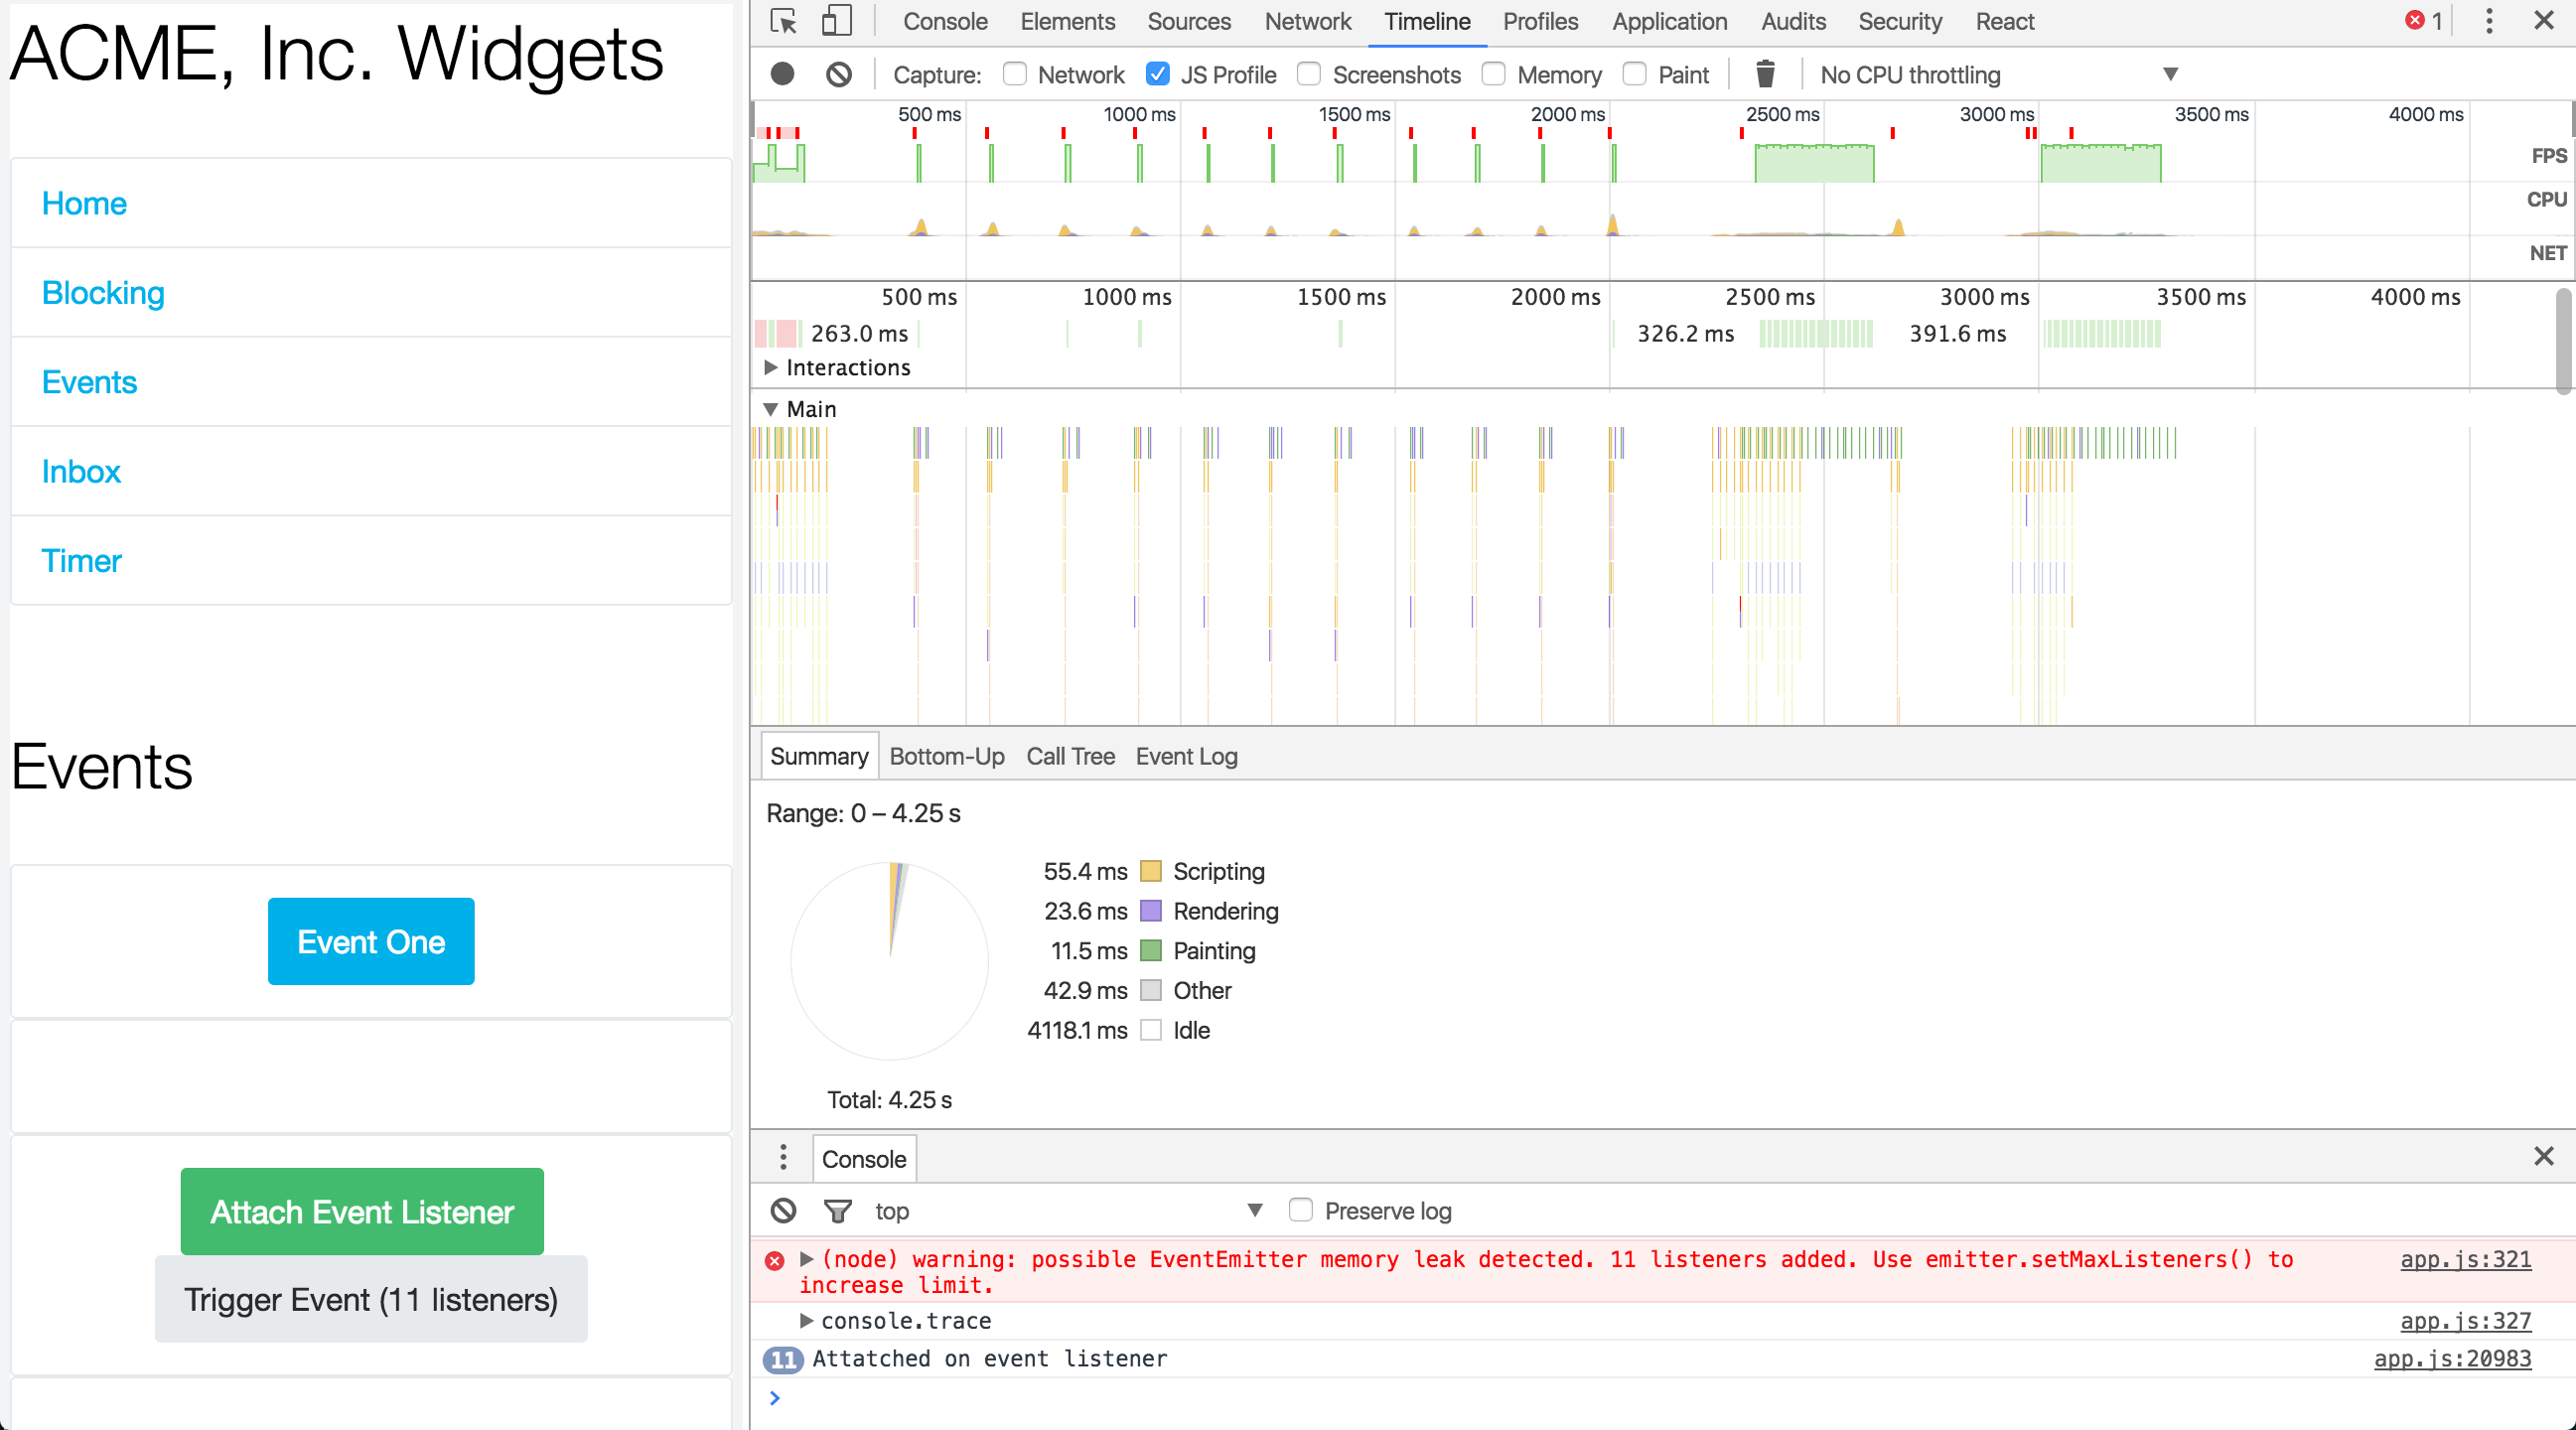
* Events
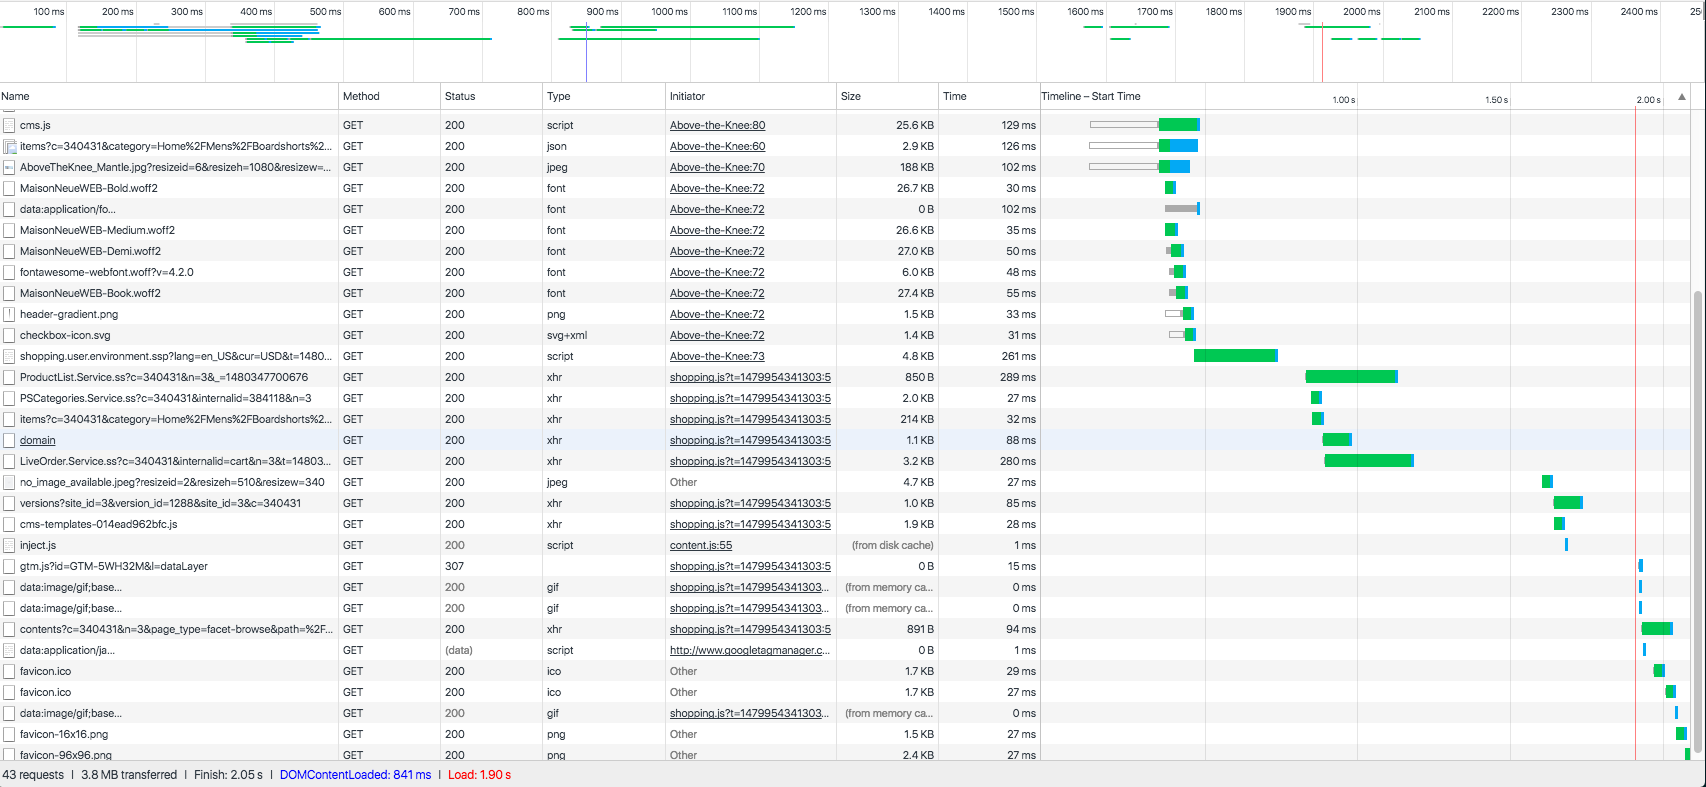
* Network
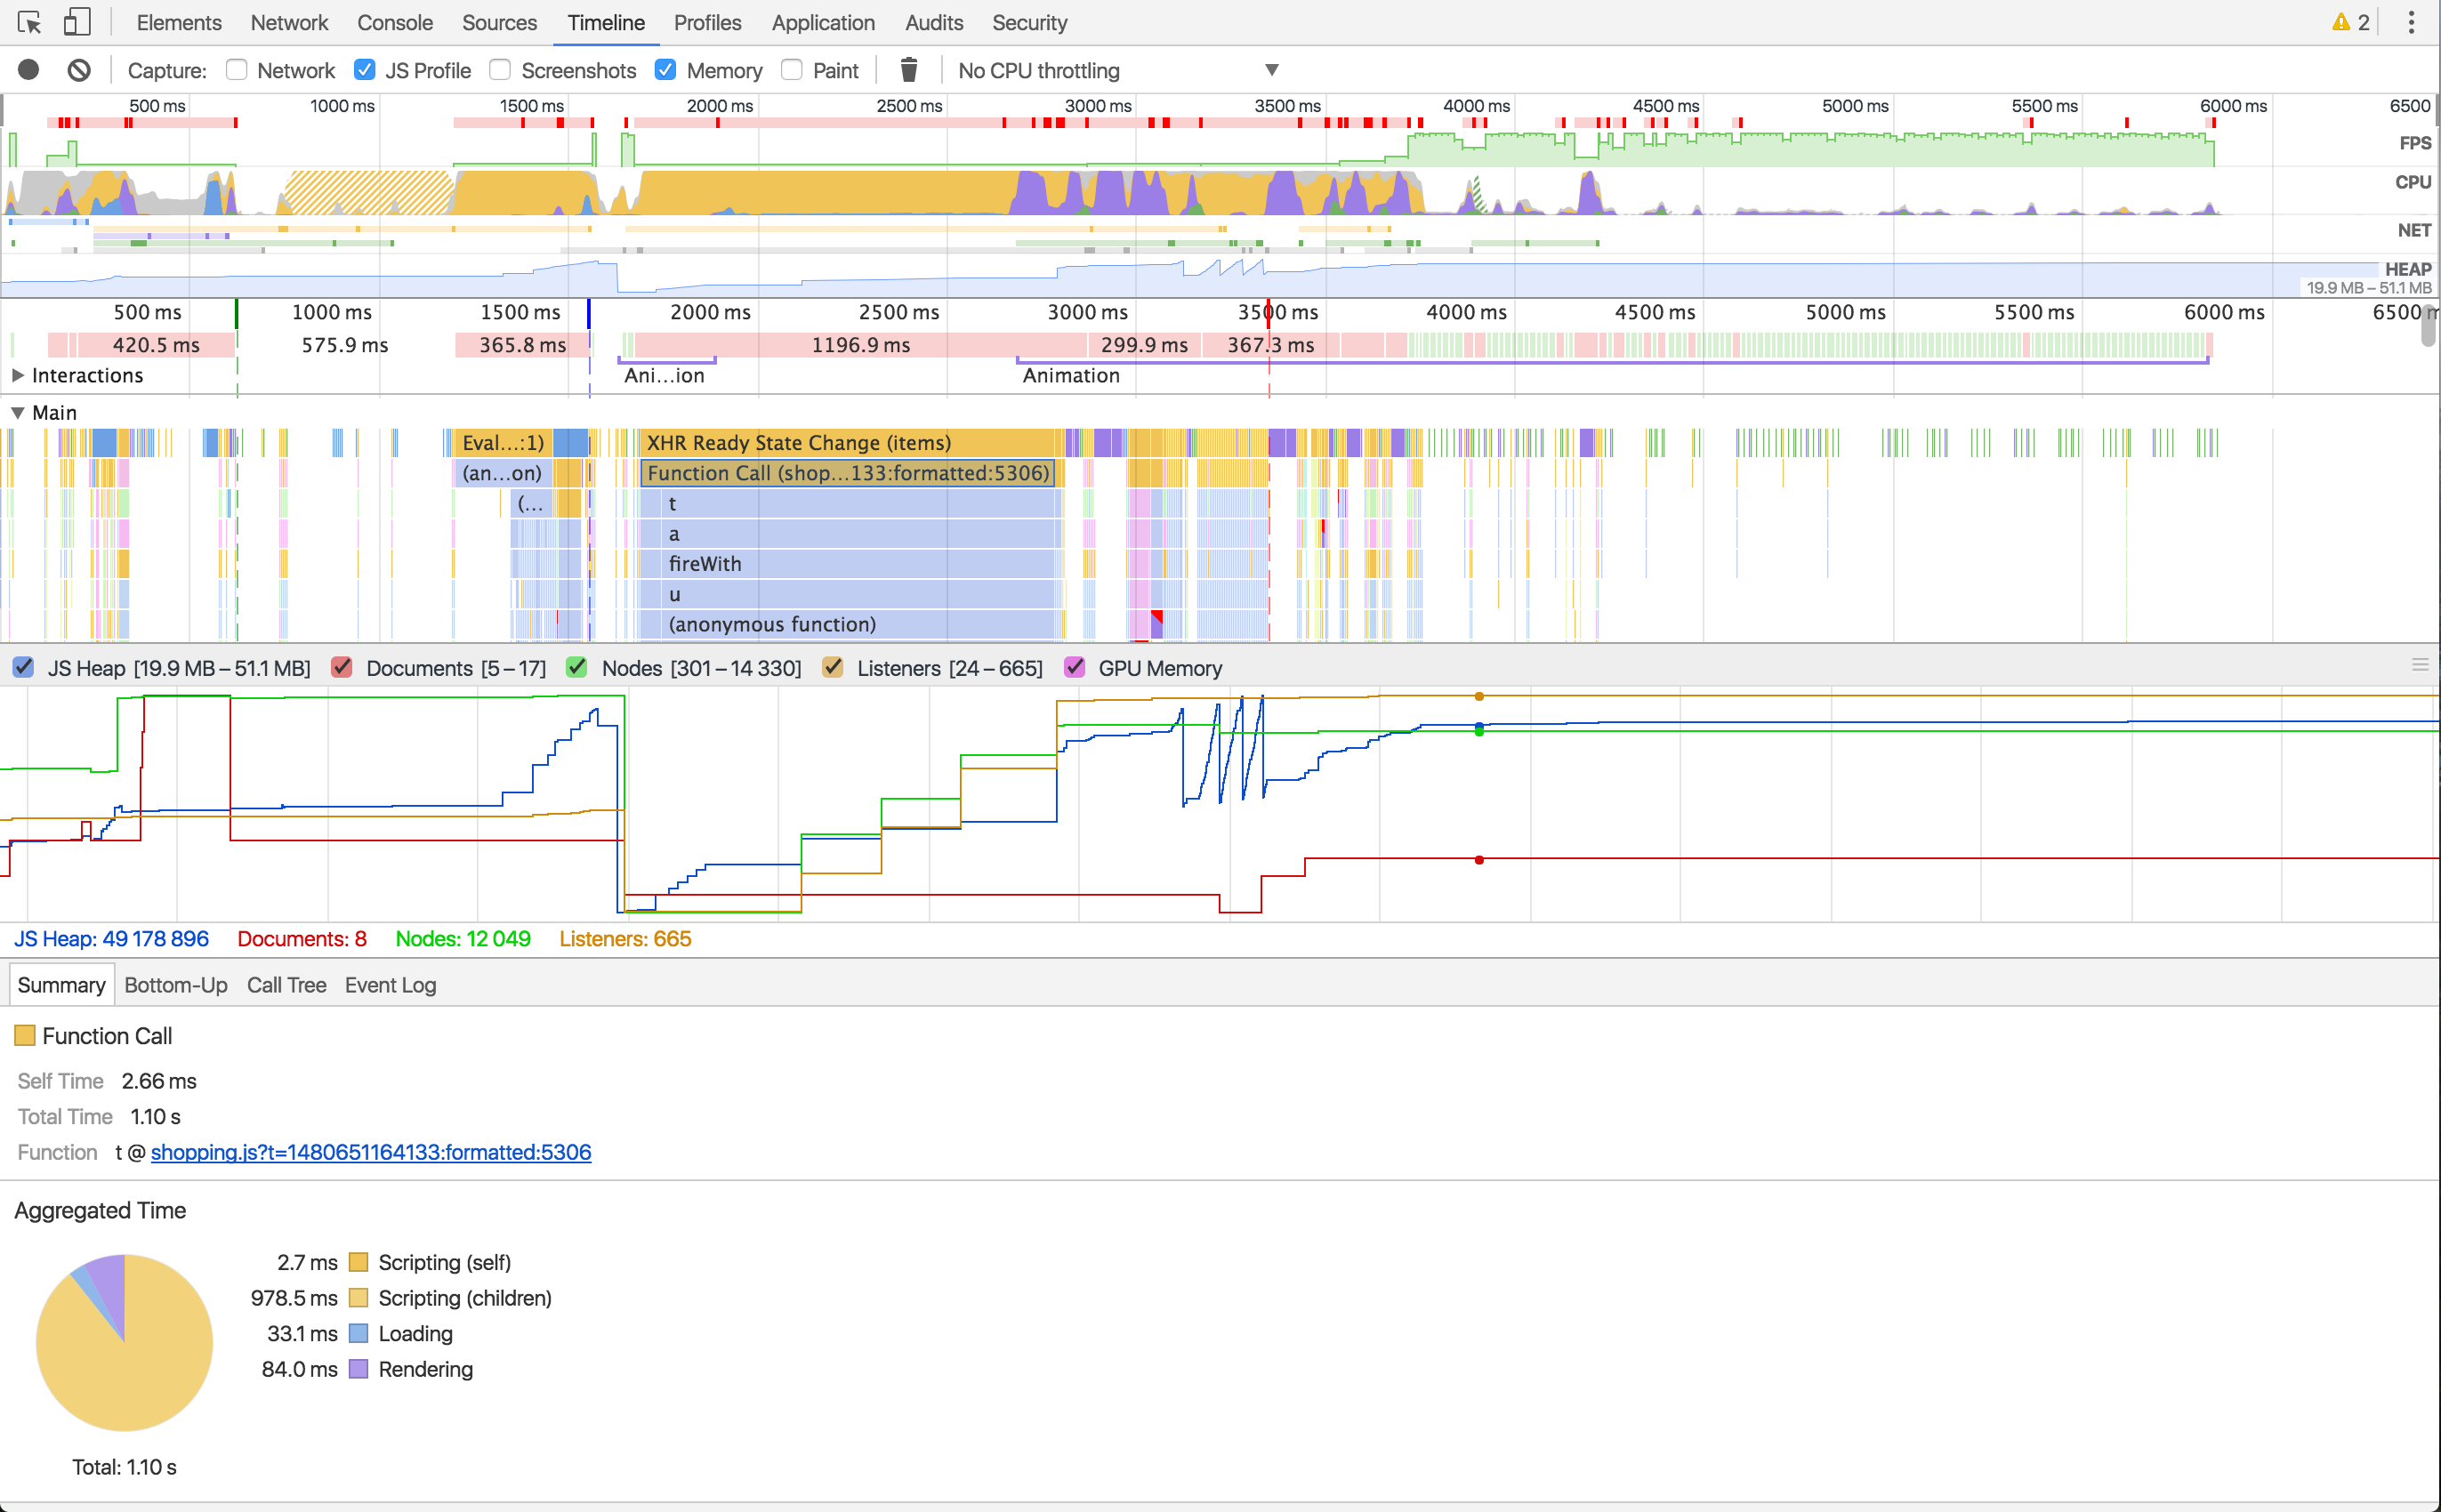
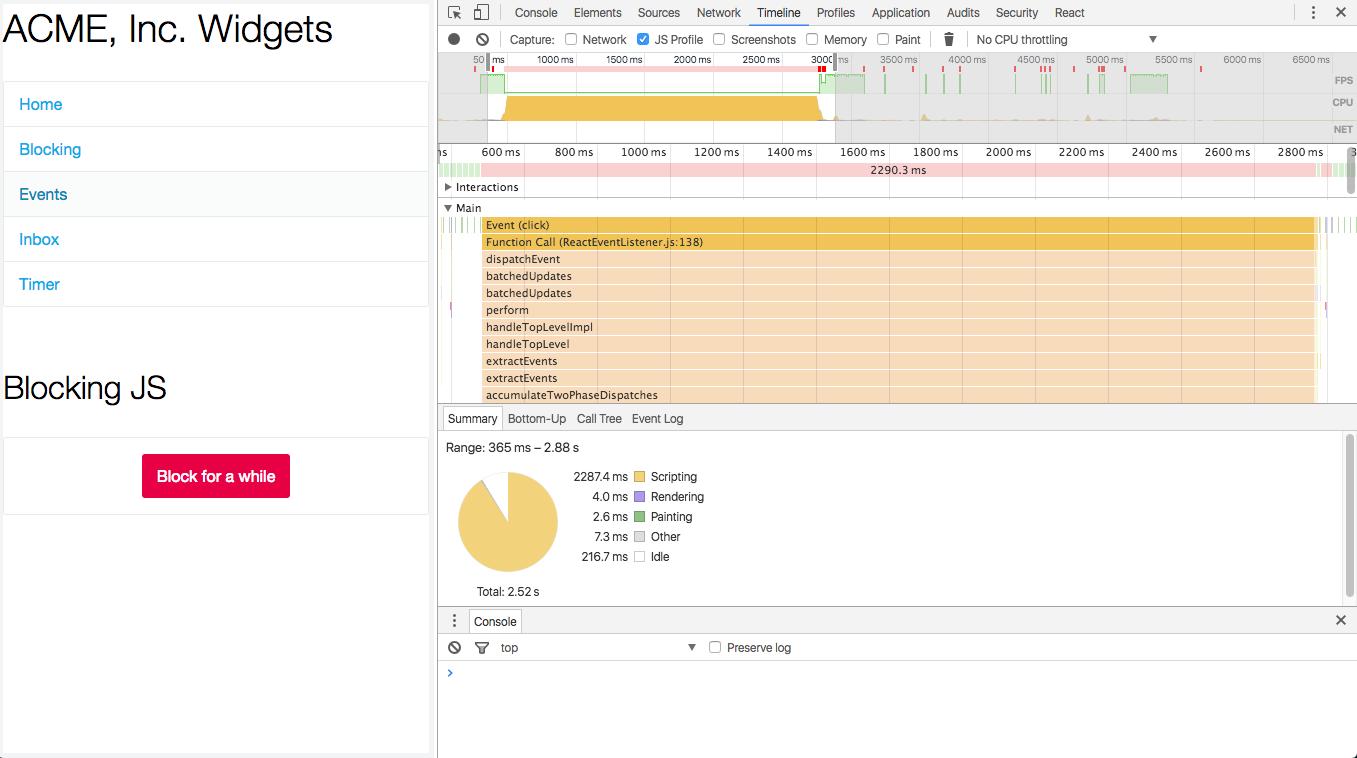
* Timeline
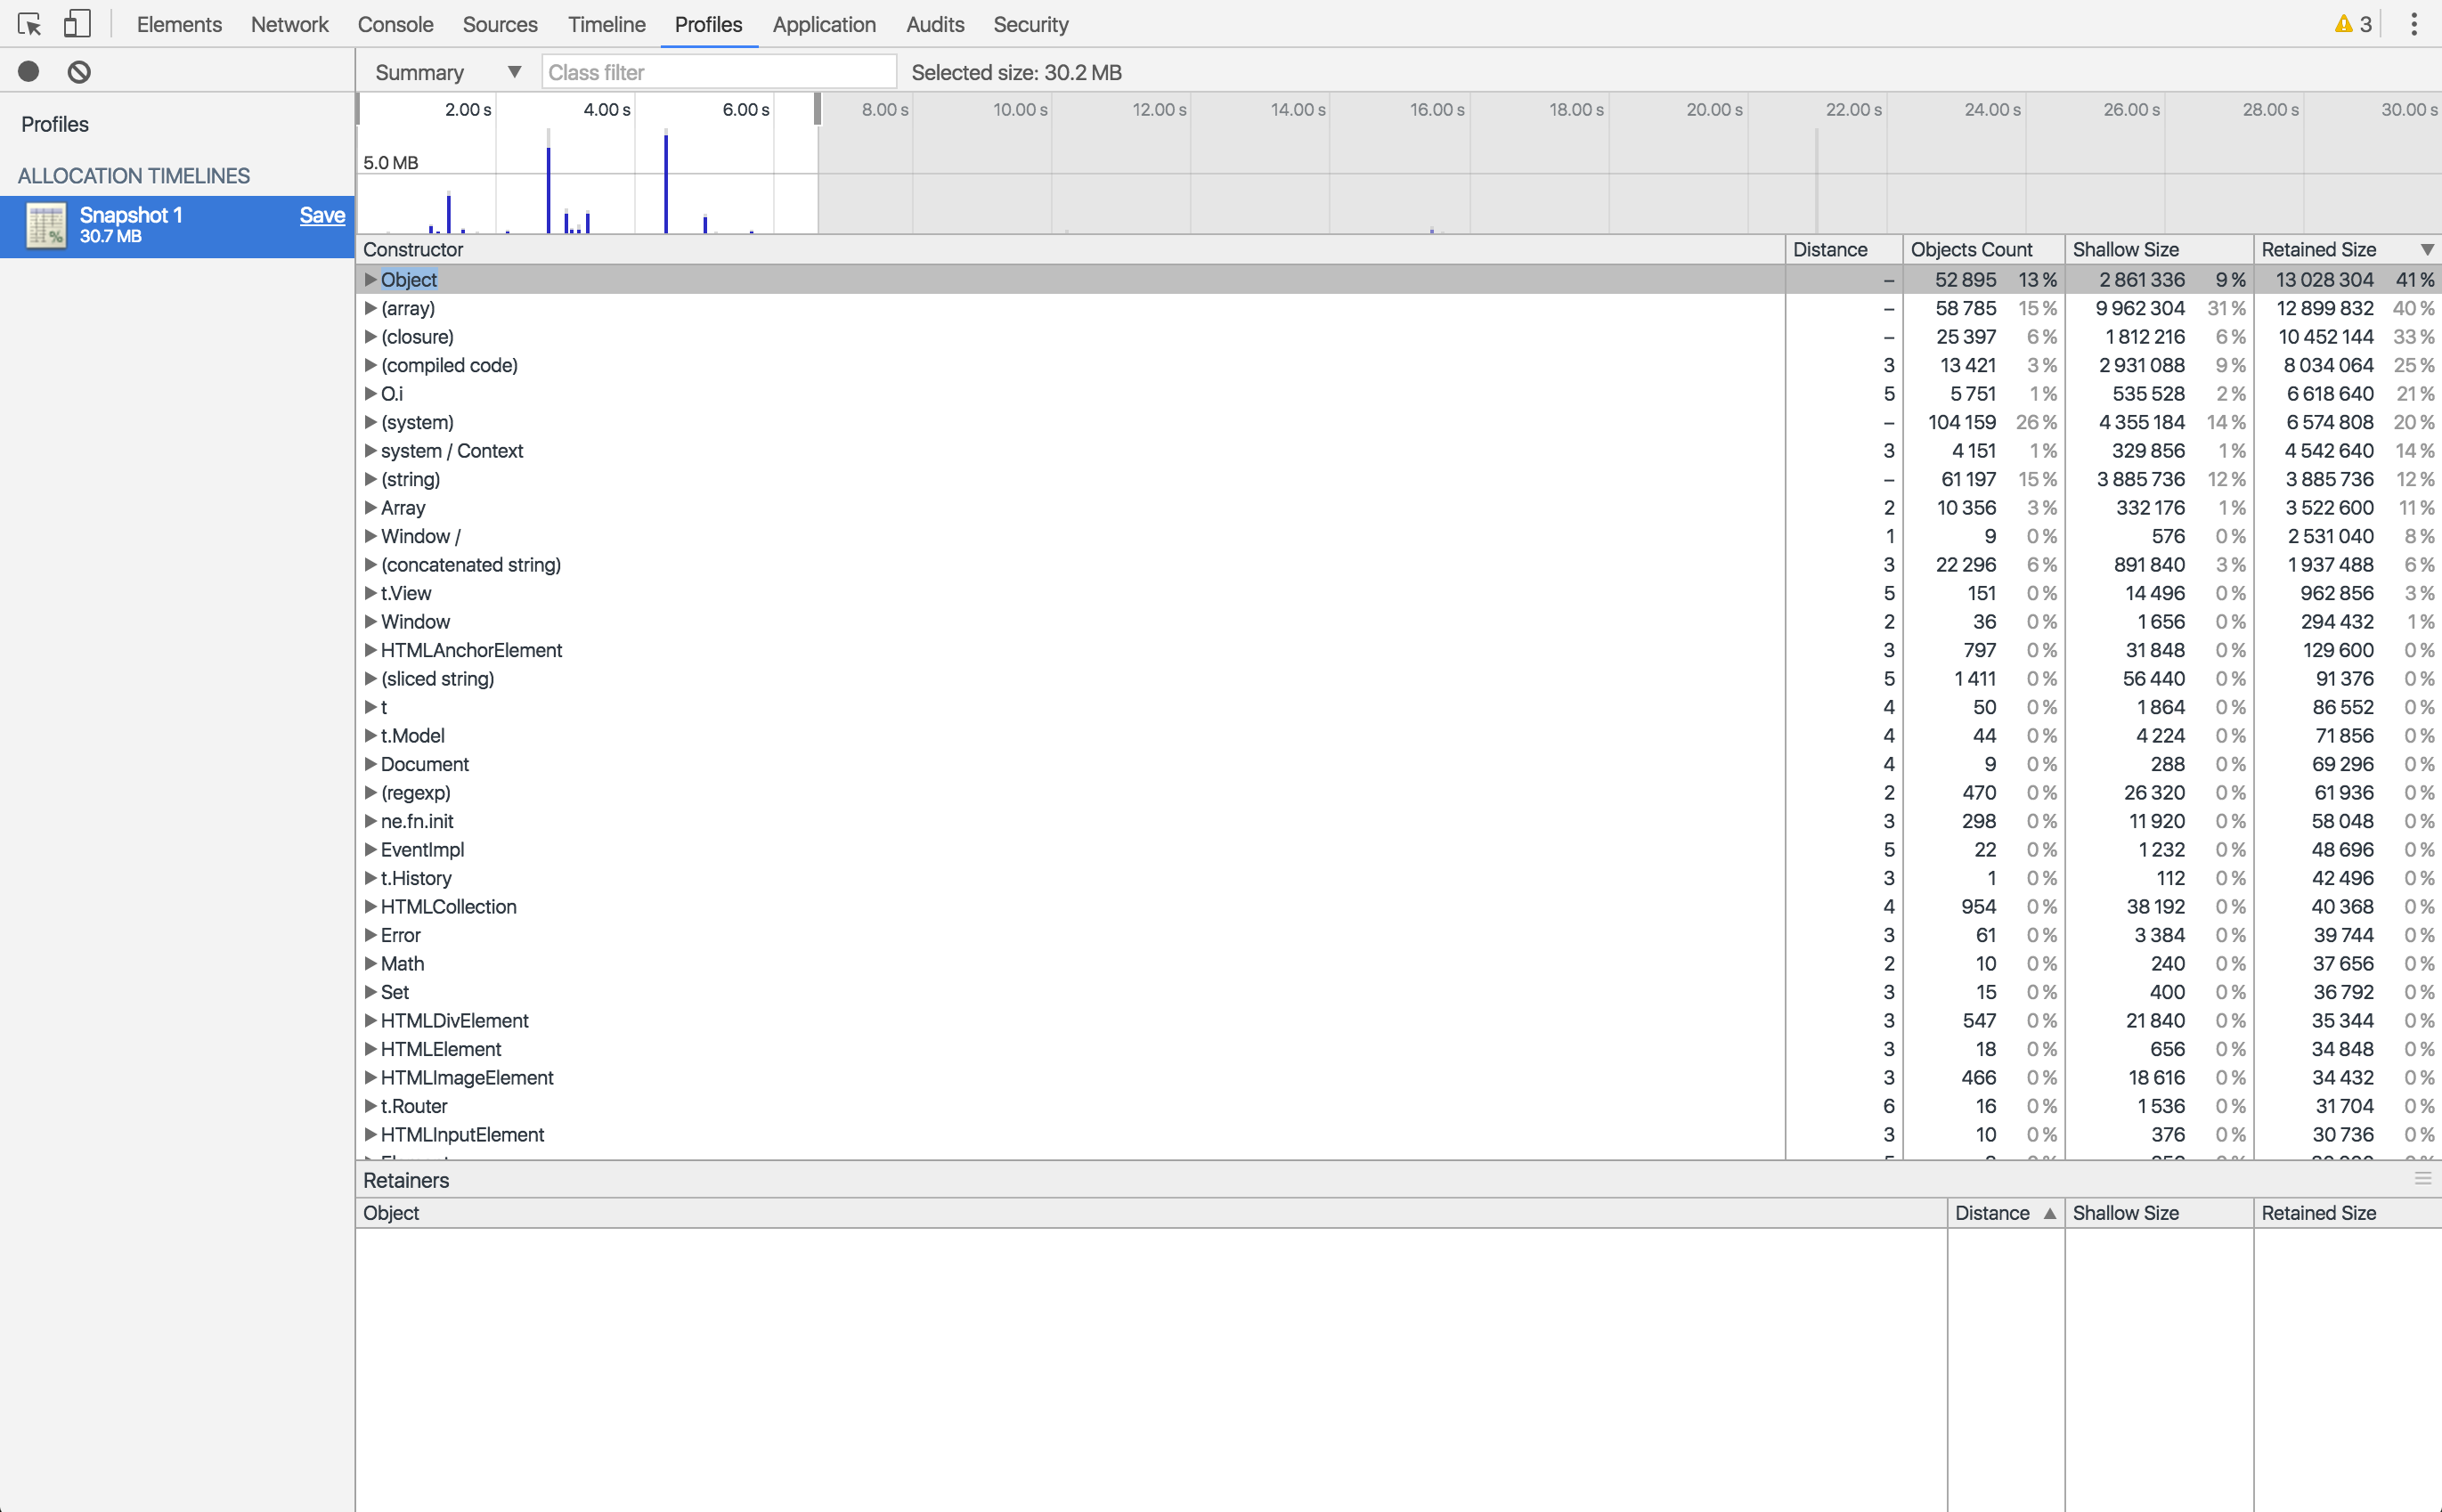
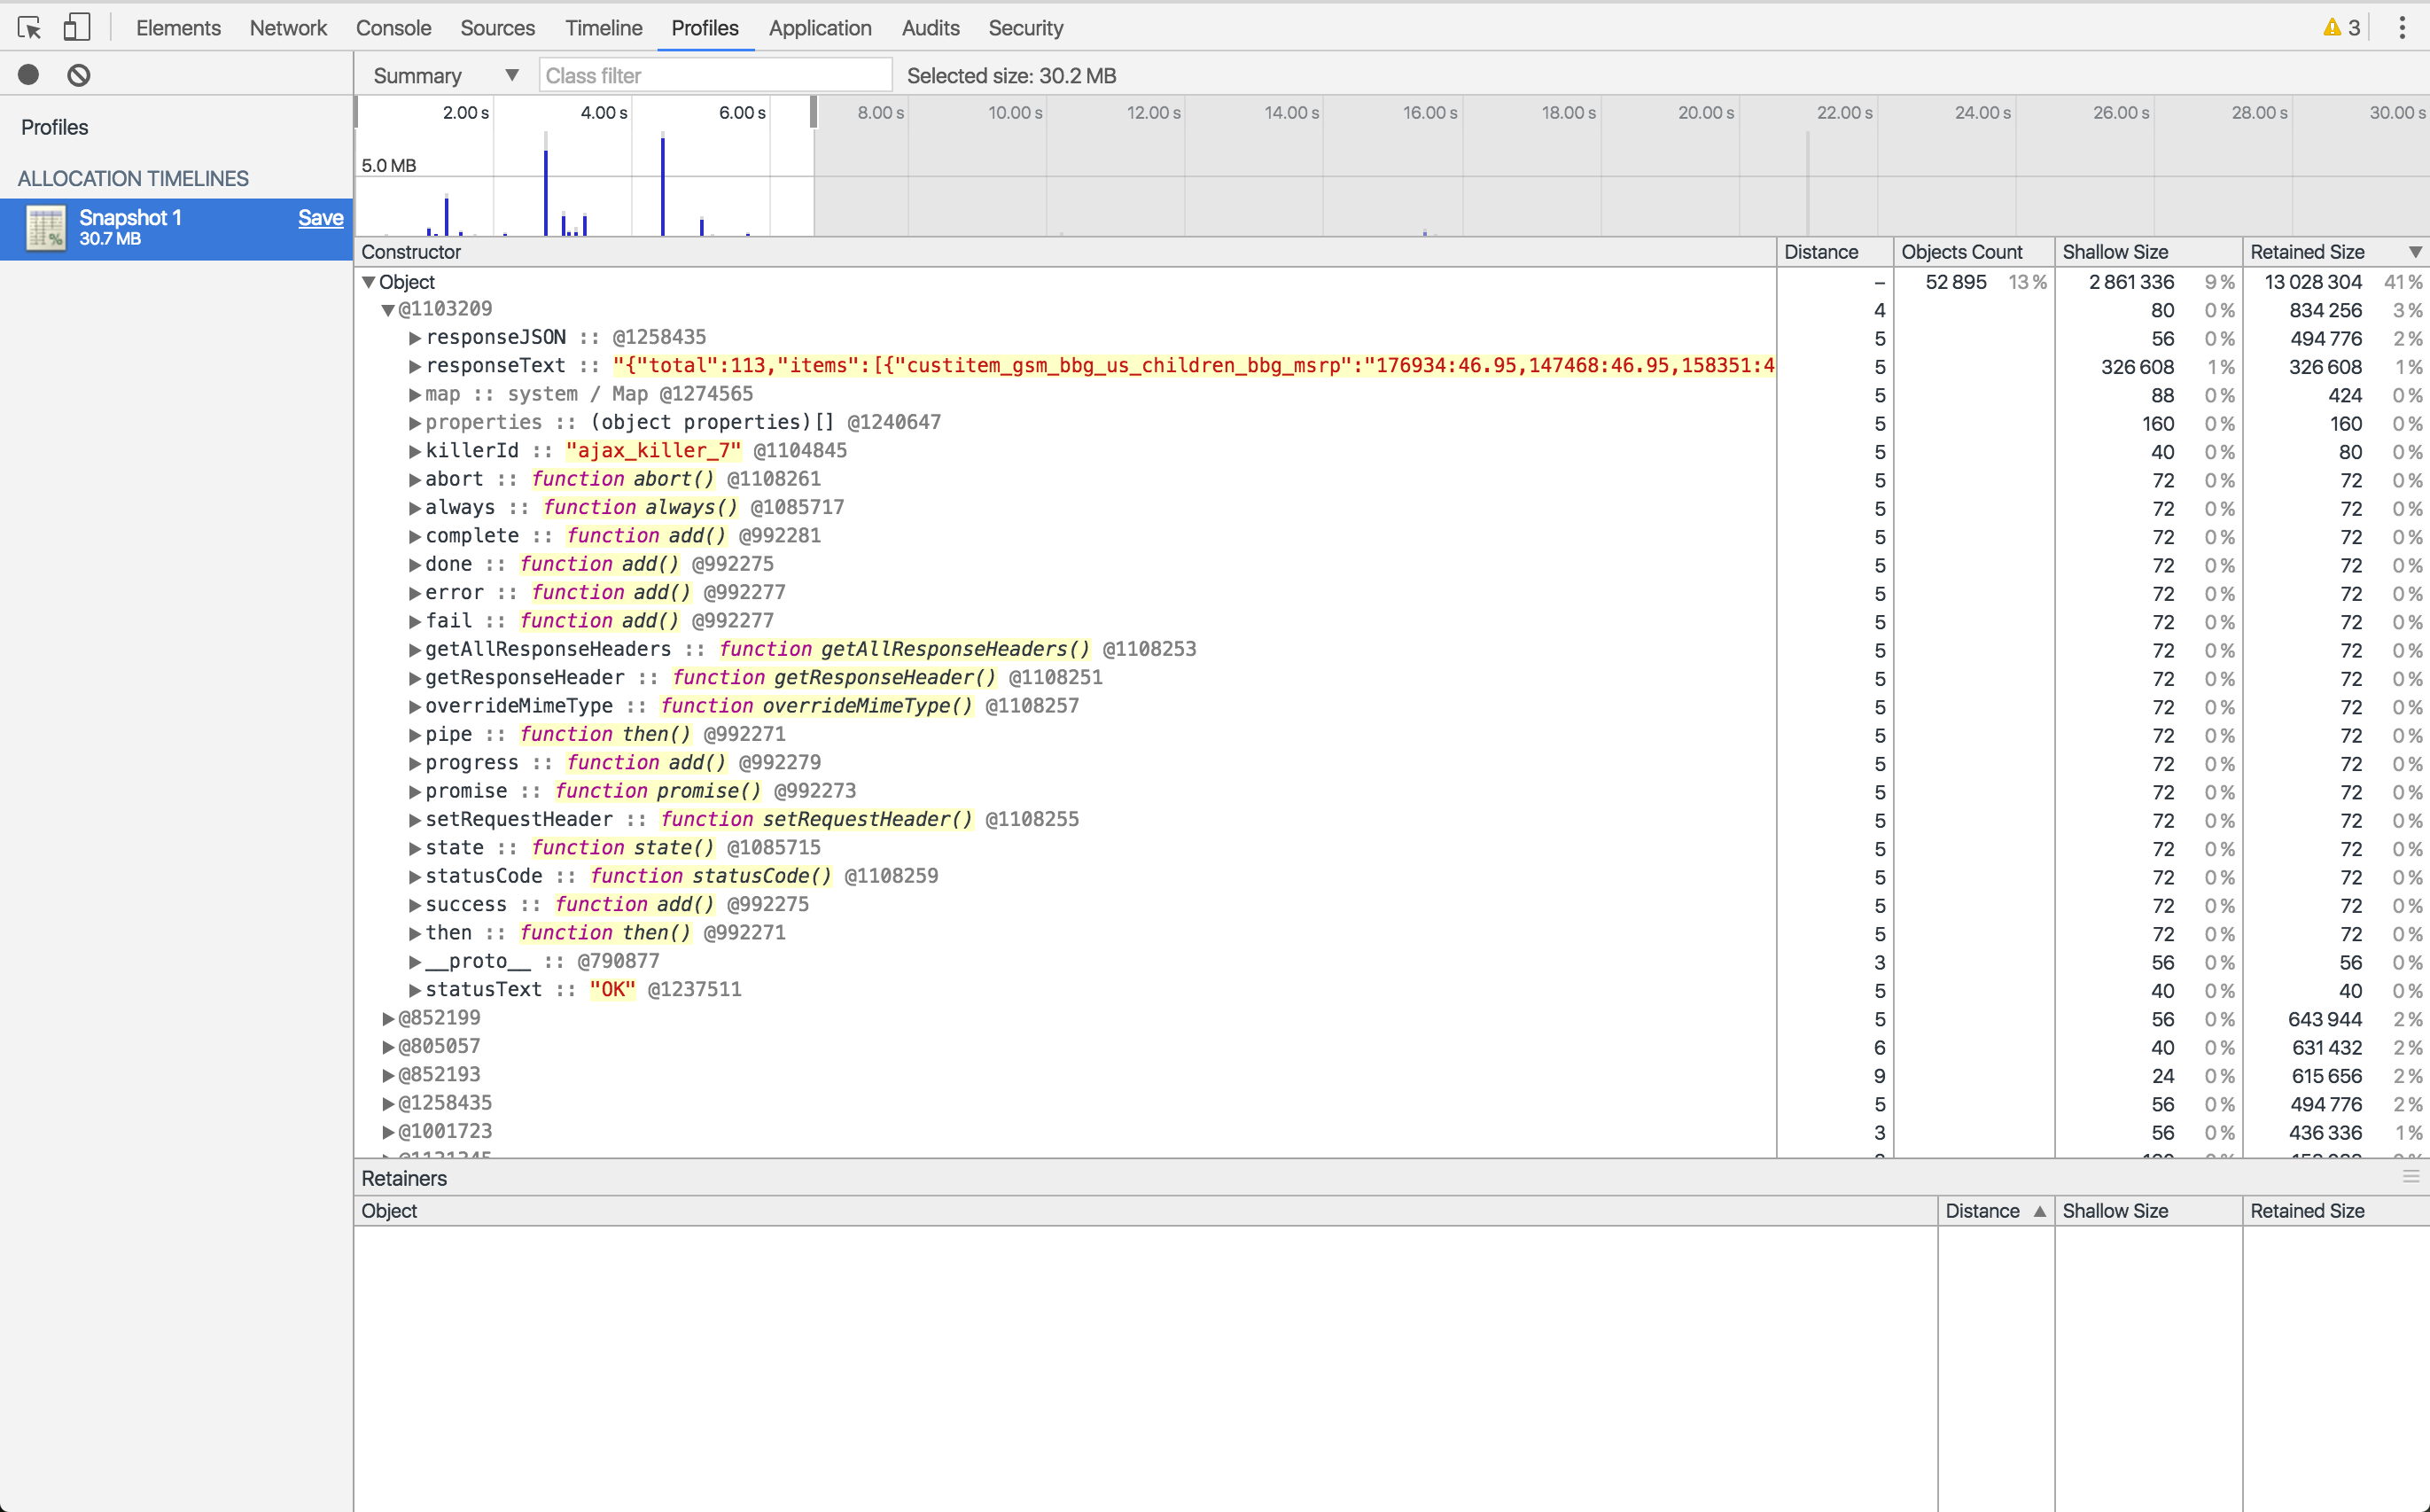
* Profiles
## Symptoms
* Performance progressively worse over time (memory leak)
* Significant or frequent performance delays and pauses (garbage collection)
* Performance consistently bad (memory bloat)